Paper Title :
A Meta-Analysis Of The Impact Of Education On Migration
Abstract
This paper represents a clear departure from the
migration literature and a first attempt in applying a meta-analysis
on the impact of education on migration behaviour. A three-part
meta-analysis is applied on twenty-two rigorously selected studies
examining education as one of the determinants of migration. The
first part, the standard meta-analysis, finds that most of the effect
sizes or the impact of the education variable to bepositive, i.e.
indicating that the more educated tend towards migrating. The
summary impact of the education coefficient estimate is found to have
a magnitude of approximately +0.300. The second part of the meta-analysis checks for publication bias; formal tests suggest no evidence
of such bias in our meta-analysis. In the final part, a meta-regression
is used to account for the source of heterogeneity in the coefficient
estimates between studies, in which six of the study characteristics
are found significant.
Author:
Jan-Jan Soon
Department of Economics & Agribusiness
Universiti Utara Malaysia
Sintok, Malaysia
Paper Transcript of Paper Titled :
A Meta-Analysis Of The Impact Of Education On Migration
A Meta-Analysis Of The Impact Of Education On Migration
Jan-Jan Soon
Department of Economics & Agribusiness
Universiti Utara Malaysia
Sintok, Malaysia
Abstract— This paper represents a clear departure from the migration literature and a first attempt in applying a meta-analysis on the impact of education on migration behaviour. A three-part meta-analysis is applied on twenty-two rigorously selected studies examining education as one of the determinants of migration. The first part, the standard meta-analysis, finds that most of the effect sizes or the impact of the education variable to be positive, i.e. indicating that the more educated tend towards migrating. The summary impact of the education coefficient estimate is found to have a magnitude of approximately +0.300. The second part of the meta-analysis checks for publication bias; formal tests suggest no evidence of such bias in our meta-analysis. In the final part, a meta-regression is used to account for the source of heterogeneity in the coefficient estimates between studies, in which six of the study characteristics are found significant.
Keywords- skilled migration; education; meta-analysis
Introduction
Education has often been singled out as the predominant determinant of migration. Education is almost always included as one of the regressors when explaining what determines migration, regardless if the issue is about skilled or the more general type of migration such as regional or rural-urban migration. Although a relatively large proportion of studies conclude that education has a significant and positive impact on migration, there appears to be no consensus in the literature on the magnitude (i.e. size of the coefficient estimate) and the direction (i.e. coefficient sign) of the impact. Some studies even find education to be statistically insignificant in determining migration.
Until recently, studies on the determinants of migration typically review the literature narratively and manipulate arguments subjectively to suit the stance of the studies. A meta-analysis is a quantitative literature review, where the literature is reviewed in a methodologically rigorous way with formal hypothesis tests and statistics to support the review. The objective of a meta-analysis is not to discredit certain studies (e.g. studies with unconventional negative coefficient of the education variable), but rather to integrate and synthesize the many often-contradicting findings and conclusions from the mushrooming literature.
Meta-analysis has its roots in the field of educational research, in which Glass [1, 2] is credited as the pioneer of this analytical approach. Meta-analysis is used in this field to assess, among others, the impact of teachers’ qualifications on students’ performance, and the types of learning intervention on examination scores. The meta-analysis approach gradually permeates into other fields such as psychology, biomedical science, pharmacology, ecology, criminology, and business. The breakthrough of meta-analysis into the field of economics is made through the seminal article in [3]. They went on to produce the first application of meta-analysis within economics in their study on the union-nonunion wage gap [4]. Following this, meta-analysis has been adopted in economic subfields such as education, labour, transportation, urban, and recreational economics.
In migration economics, meta-analysis has been applied mainly on the impact of migration – its impact on wages [5, 6], on employment [7], on income [8], and on international trade [9]. This paper looks at the other side of the coin, i.e. what determines migration. More specifically, this paper looks at how education impacts migration (both general and skilled migration). In the literature of migration economics, education plays a crucial role on migration behaviour; the better-educated appear to be more mobile than their less-educated counterparts.
There are, however, a number of studies that suggest otherwise, as revealed by the negative coefficient sign of the education variable [10, 11, 12, 13]. Such inconsistencies in individual studies may be due to either (i) real differences in how the education variable can impact migration, or (ii) differences in the characteristics of the migration studies. To date, there are yet to be any meta-analyses examining this issue – a gap this study is filling.
Methodology
Methodology Set-up
The primary objective of a meta-analysis is to synthesize the often individually inconclusive and seemingly irreconcilable results of a large number of studies, to come up with a summary effect size, i.e. the average coefficient estimate of the education variable in the context of this study. Its ability to synthesize individually disparate studies can yield more rigorously sound statistical evidence than the relatively less-convincing and often subjective narrative literature review. A meta-analysis starts by defining a dependent and an explanatory variable of interest. Here, the dependent variable is the migration behaviour (i.e. decision or intention), and the explanatory variable is the level or years of education obtained. A list of inclusion/exclusion criteria is then drawn up. Studies that meet the criteria will be included in the meta-analysis. These criteria are necessary so that the eventual dataset contains studies with a manageable degree of heterogeneity, and therefore facilitates comparison. Table 1 lists those criteria. Based on the above criteria, relevant literature on migration are scoured via electronic economic databases. When combing through these databases, the following keywords are used:
Inclusion/Exclusion Criteria
Study |
IndividualA |
CumulativeB |
Study OmittedC |
||||
|
Coeff |
Std err. |
Coeff |
Std err. |
Coeff |
95% Confidence interval |
|
Vijverberg 1993 |
-0.011 |
0.021 |
-0.011 |
0.021 |
0.310 |
0.001 |
0.620 |
Chen & Su 1995 |
0.251 |
0.179 |
0.059 |
0.116 |
0.302 |
0.014 |
0.590 |
De Jong et al 1996 |
0.630 |
0.670 |
0.069 |
0.107 |
0.291 |
0.008 |
0.575 |
Burda et al 1998 |
0.471*** |
0.135 |
0.238 |
0.165 |
0.290 |
0.002 |
0.579 |
Zhao 1999 |
0.346 |
0.340 |
0.249* |
0.149 |
0.298 |
0.011 |
0.584 |
De Jong 2000 |
0.862** |
0.401 |
0.314** |
0.152 |
0.278 |
-0.008 |
0.564 |
Papapanagos & Sanfey 2001 |
0.260** |
0.131 |
0.291** |
0.123 |
0.301 |
0.013 |
0.590 |
Boheim & Taylor 2002 |
0.157*** |
0.046 |
0.226*** |
0.080 |
0.306 |
0.013 |
0.599 |
Fan 2002 |
3.14*** |
0.039 |
0.681 |
0.558 |
0.147† |
0.076 |
0.218 |
Drinkwater 2003 |
-0.073** |
0.031 |
0.603 |
0.433 |
0.317 |
0.021 |
0.614 |
Liebig & Sousa-Poza 2004 |
0.292*** |
0.024 |
0.573* |
0.336 |
0.295 |
-0.011 |
0.601 |
Chiquar & Hanson 2005 |
-3.537*** |
0.679 |
0.309 |
0.326 |
0.394† |
0.110 |
0.677 |
Fidrmuc 2005 |
0.604 |
0.517 |
0.329 |
0.315 |
0.289 |
0.005 |
0.575 |
Van Dalen et al 2005 |
0.330*** |
(0.180) |
0.329 |
(0.301) |
0.298 |
0.010 |
0.586 |
Epstein & Gang 2006 |
0.047** |
(0.021) |
0.324 |
(0.250) |
0.307 |
-0.003 |
0.617 |
Mora & Taylor 2006 |
0.144*** |
(0.018) |
0.327 |
(0.209) |
0.299 |
-0.020 |
0.619 |
Brucker & Trubswetter 2007 |
-0.068 |
(0.110) |
0.302 |
(0.201) |
0.319 |
0.030 |
0.607 |
Van Dalen & Henkens 2007 |
0.250*** |
(0.087) |
0.299 |
(0.194) |
0.302 |
0.013 |
0.591 |
Fidrmuc & Huber 2007 |
0.265 |
(0.299) |
0.298 |
(0.189) |
0.301 |
0.015 |
0.588 |
Constant & Agosto 2008 |
0.166 |
(0.276) |
0.291 |
(0.184) |
0.306 |
0.019 |
0.592 |
Huber & Nowotny 2011 |
0.273* |
(0.164) |
0.290 |
(0.179) |
0.301 |
0.013 |
0.589 |
Sun & Fan 2011 |
0.169*** |
(0.011) |
0.300** |
(0.143) |
0.290 |
-0.060 |
0.641 |
Significant at the *10%, **5%, and ***1% level.
† Influential study.
Pane A, B, C.
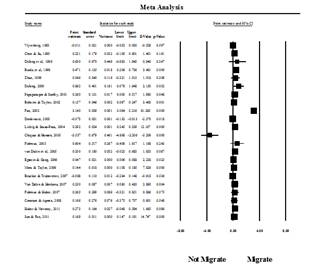
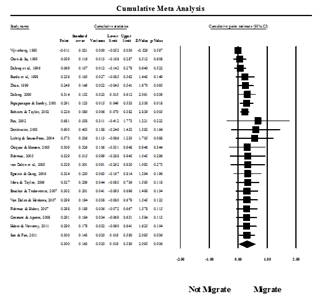
Using the random-effects approach, the summary effect is computed to be 0.300 with a standard error of 0.143 and a p-value = 0.036.
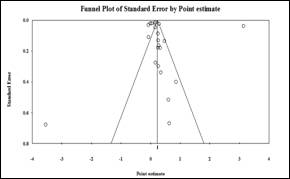
From Figure 4, there seems to be a bias towards publication with positive coefficient estimates. Formal tests of publication bias however, suggest otherwise. At the 5% significance level, both Egger’s test (p-value = 0.586) and Begg’s test (p-value = 0.055) suggest no evidence of publication bias. Rosenthal’s (1979) classic fail-safe N is 2,642 (a p-value much less than 1%), suggesting that the possibilities are remote for us to have missed out on more than 2,600 studies in the related migration literature. We however, cannot preclude the possibility of language bias since only English-language publications are searched. Nevertheless, it is believed that non-English scholarly publications would not have been significant enough to cause a serious publication bias.
Meta-Regression
Meta-regression investigates the extent to which statistical heterogeneity between results of multiple studies can be related to one or more characteristics of the studies [19]. It is the best way to account for heterogeneity or between-study variance [20]. Through meta-regressions, observed heterogeneity can be accounted for, in which study characteristics explain some of the variations in the coefficient estimates between the studies. That is, meta-regression can help to answer questions like why some studies obtained positive/negative coefficient estimates, why some of their magnitudes are larger than those of other studies, and why some of the estimates in certain studies are significant while others insignificant. In doing the meta-regression here, we take into account study characteristics as listed in Table 3.
- Table 3. Study characteristics statistics and meta-regression coefficient estimates.
Characteristic |
Defined as |
Mean |
Meta-Coeff |
Std Err. |
yrpublish |
Year the study is published |
n.a. |
0.309* |
0.138 |
size |
Sample size |
6932.14 |
-0.0001** |
0.00004 |
multispec |
Number of model specification examined |
3.55 |
-0.108 |
0.079 |
impactfac |
Impact factor of publication |
0.30 |
-1.015 |
0.831 |
international |
1 if examining cross national border migration |
0.50 |
0.300 |
0.718 |
actual |
1 if dependent variable is on actual migration decision |
0.55 |
-1.243 |
1.096 |
logit |
1 if a logit model is used |
0.32 |
1.677 |
1.141 |
skilled |
1 if examining skilled migration or brain drain |
0.14 |
3.986* |
2.075 |
edulevel |
1 if the education variable is by education level |
0.82 |
1.658* |
0.753 |
cross |
1 if cross-sectional data is used |
0.86 |
-1.107 |
1.276 |
student |
1 if respondents are students |
0.10 |
-4.906* |
2.223 |
europe |
1 if the examined region is in Europe |
0.50 |
-1.628* |
0.758 |
journal |
1 if the publication is in an academic journal |
0.81 |
-1.591 |
0.872 |
Dependent variable = effect size or the coefficient estimates of the education variable; n.a. = non-applicable; Number of studies, n=22. Mean
for categorical study characteristics represents the proportion with the characteristic indicated. Significant at the *10%, and **5% level. Study
characteristics are also known as moderator variables (Stanley 2001).
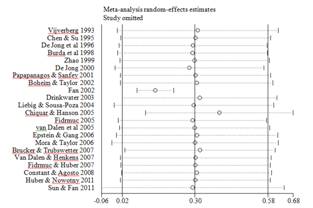
Results from the meta-regression indicate presence of heterogeneity in the coefficient estimates, with a between-study variance (or the variance of the true effect sizes) of t2=0.836, significant at the 1% level. The proportion of observed variance reflecting real differences in effect size is I2=99.7%, i.e. 99.7% of the observed variance is due to real differences in the studies rather than to random error. Such heterogeneity is also obvious from Figure 1. Had there been no heterogeneity issues, all the squares would have aligned to a straight vertical line.
Results from Table 3 suggest that the source of heterogeneity in the coefficient estimates of the education variable come from six of the study characteristics, i.e. the significant meta-regression coefficients. In running a meta-regression, we are basically estimating the following.
![]()
where,
bj = the reported coefficient estimate of the education variable of the jth study from a total of L studies
![]() = the ‘true’ value of the parameter of interest
= the ‘true’ value of the parameter of interest
![]() = the study characteristics
= the study characteristics
![]() = the meta-regression coefficient that reflects the biasing effect of particular study characteristics
= the meta-regression coefficient that reflects the biasing effect of particular study characteristics
![]() = the meta-regression error term
= the meta-regression error term
j = 1, 2, …, L
The publication year of a study is positively associated with the coefficient magnitude of the original studies, i.e. +0.309; more recent publications found larger positive impact of education on migration intention/decision. This result is also supported by the absence of publication bias discussed in the previous section. Publication bias tends to occur when publications are
focused on obtaining positive and statistically significant results. The fact that we found no evidence of publication bias and that the meta-coefficient shows a significant +0.309, may be pointing to the fact of an increasing impact of education after all. The positive meta-coefficient of the ‘skilled’ variable (i.e. 3.986) indicates that when a study examines skilled migration or the brain drain phenomenon, the effect size of the education variable increases, resulting in corresponding increases in the probability to migrate. When skilled migration is the issue, the education variable is understandably important and has a significant positive impact on the migration probability of the highly educated. The meta-coefficient of the education variable is +1.658, suggesting that when education level dummies are used in the original studies instead of using years of education, the impact of education on migration intention/decision tends to be positive. One possibility is perhaps the real effect of education is more readily captured by the level of education (i.e. a real difference between the level of a high school diploma and that of a doctoral degree, for instance), than by the years of having been in formal schooling.
At –0.0001, the negative impact of sample size on the coefficient magnitudes is relatively negligible although it has a stronger statistical significance. The negative impact of sample size here suggests that as more respondents are surveyed on their migration intention/decision, the impact of education (i.e. the coefficient magnitude of the education variable) decreases. The negative relationship casts doubts on the presence of genuine empirical effect of the impact of education on migration intention/decision [21]. This result however, could also be due to noise from a heterogeneously large cross-sectional sample. The practical significance of sample size nevertheless remains somewhat trivial. When the migration issue is examined in European region, the impact of the education variable decreases and translates into decreasing probabilities to migrate. This suggests plausibility of easier mobility within the European region, and therefore less importance might be placed on education as a mobility passport. Similarly, when students instead of working professionals are examined, the impact of education on migration behaviour also decreases. The students examined in the original studies are typically foreign students studying in a host country. Since they are already in the host countries, the level of education they are pursuing there is not as important as say other reasons such as assimilation process, insiders’ information, and networking, for example. On the contrary, the education level or years of education that working professionals possess might be more crucial in influencing their migration behaviour.
CONCLUSION
This paper may well represent the first meta-analysis application on the impact of education on migration. This is a clear departure from the typical analyses used in the migration literature. Here, we have delineated the standard set-up of the analysis, by first doing a meta-analysis to obtain the summary effect size, followed by a publication bias check, and a meta-regression to identify the source of heterogeneity in effect size. A total of 22 micro-level studies that look at the determinants of migration have been analysed. These papers have included the education variable as one of the regressors, where it is operationalized either as the years of education or the highest level of education obtained. The outcome or dependent variable of these selected studies is either on actual migration behaviour, or on the intention to migrate. The meta-analysis conducted here comprises three parts: the meta-analysis, publication bias check, and meta-regression. Results from the meta-analysis conclude the summary impact of the education coefficient to be approximately +0.300. Results from formal tests on publication bias show no evidence of such bias. A meta-regression is used to account for the source of heterogeneity in the coefficient estimates. Six of the study characteristics are identified to be contributing to the heterogeneity.
An extension of this paper will incorporate coefficient estimates of the education variable from all different model specifications used within a study, instead of only including the coefficient from the base model. Another possible extension is to do a meta-analysis on a vector of coefficients of a number of variables, and not just limited to meta-analysing the impact of the education variable on migration decision.
References
Glass, G. V. (1976). Primary, secondary, and meta-analysis of research. Educational Researcher, 5(10): 3-8.
Glass, G. V. (1977). Integrating findings: The meta-analysis of research. Review of Research in Education, 5: 351-379.
Stanley, T. D. & Jarrell, S. B. (1989). Meta-regression analysis: A quantitative method of literature surveys. Journal of Economic Surveys, 3: 161-170.
Stanley, T. D. & Jarrell, S. B. (1990). A meta-analysis of the union-nonunion wage gap. Industrial and Labor Relations Review, 44: 54-67.
Longhi, S., Nijkamp, P. & Poot, J. (2010). Joint Impacts of Immigration on Wages and employment: Review and Meta-analysis. Journal of Geographical Systems, 12: 355-387.
Longhi, S., Nijkamp, P., & Poot, J. (2005). A meta-analytical assessment of the effect of immigration on wages. Journal of Economic Surveys, 19: 451-477.
Longhi, S., Nijkamp, P., & Poot, J. (2006). The impact of immigration on the employment of natives in regional labour markets: A meta-analysis. IZA Discussion Paper Series, No. 2044, Bonn: Institute for the Study of Labor (IZA).
Ozgen, C., Nijkamp, P. & Poot, J. (2010). The effect of migration on income growth and convergence: Meta-analytic evidence. Papers in Regional Science, 89(3): 537-561.
Genҫ, M., Gheasi, M., Nijkamp, P. & Poot, J. (2011). The impact of immigration on international trade: a meta-analysis. NORFACE Migration Discussion Paper Series, No. 2011-20, London: New Opportunities for Research Funding Cooperation Agency in Europe (NORFACE).
Vijverberg, W. P. M. (1993). Labour market performance as a determinant of migration. Economica, 60(238): 143-160.
Drinkwater, S. (2003). Go West? Assessing the willingness to move from Central and Eastern European countries. FLOWENLA Discussion Paper, No. 5, Hamburg Institute of International Economics.
Chiquiar, D. & Hanson, G. H. (2005). International migration, self-selection, and the distribution of wages: Evidence from Mexico and the United States. Journal of Political Economy, 113(2): 239-281.
Brucker, H. & Trubswetter, P. (2007). Do the best go West? An analysis of the self-selection of employed East-West migrants in Germany. Empirica, 34(4): 371-395.
Rosenthal, R. (1995). Writing meta-analytic reviews. Psychological Bulletin, 118(2): 183-192.
Harris, R. J., Bradburn, M. J., Deeks, J. J., Harbord, R. M., Altman, D. G. & Sterne, J. A. C. (2008). Metan: fixed- and random-effects meta-analysis. The Stata Journal, 8(1): 3-28.
Borenstein, M., Hedges, L. V., Higgins, J. P. T. & Rothstein, H. R. (2009). Introduction to meta-analysis. Sussex: John Wiley & Sons, Ltd.
Fan, C. C. (2002). The elite, the natives, and the outsiders: Migration and labor market segmentation in urban China. Annals of the Association of American Geographers, 92(1): 103-124.
Sterne, J. A. C., & Harbord, R. M. (2004). Funnel plots in meta-analysis. The Stata Journal, 4(2): 127-141.
Thompson, S. G., & J. P. T. Higgins. (2002). How should meta-regression analyses be undertaken and interpreted? Statistics in Medicine, 21: 1559-1573.
Poot, J. (2013 forthcoming). Meta-analysis of previous empirical research findings. In Stimson, R. J. (Ed), Handbook for spatially integrated social science research methods. Cheltenham UK: Edward Elgar.
Stanley, T. D. (2001). Wheat from chaff: Meta-analysis as quantitative literature review. Journal of Economic Perspectives, 15(3): 131-150.
- Remaining studies included in the meta-analysis
Boheim, R. & Taylor, M. P. (2002). Tied down or room to move? Investigating the relationships between housing tenure, employment status and residential mobility in Britain. Scottish Journal of Political Economy, 49(4): 369-392.
Burda, M. C., Hardle, W., Muller, M. & Werwatz, A. (1998). Semiparametric analysis of German East-West migration intentions: Facts and theory. Journal of Applied Econometrics, 13(5): 525-541.
Chen, T. J. & Su, H. Y. (1995). On-the-job training as a cause of brain drain. Weltwirtschaftliches Archiv, 131(3): 526-541.
Constant, A. F. & D'Agosto, E. (2008). Where do the brainy Italians go? IZA Discussion Paper Series, No. 3325, Bonn: Institute for the Study of Labor (IZA).
De Jong, G. F., Richter, K. & Isarabhakdi, P. (1996). Gender, values, and intentions to move in rural Thailand. International Migration Review, 30(3): 748-770.
De Jong, G. F. (2000). Expectations, gender, and norms in migration decision-making. Population Studies, 54(3): 307-319.
Epstein, G. S. & Gang, I. N. (2006). The influence of others on migration plans. Review of Development Economics, 10(4): 652-665.
Fidrmuc, J. (2005). Labor mobility during transition: Evidence from the Czech Republic. William Davidson Institute Working Paper Series, No. 767, University of Michigan Business School.
Fidrmuc, J. & Huber, P. (2007). The willingness to migrate in the CEECs: Evidence from the Czech Republic. Empirica, 34(4): 351-369.
Huber, P. & Nowotny, K. (2011). Moving across borders: Who is willing to migrate or to commute? Regional Studies, DOI:10.1080/00343404.2011.624509.
Liebig, T. & Sousa-Poza, A. (2004). Migration, self-selection and income inequality: An international analysis. Kyklos, 57(1): 125-146.
Mora, J. & Taylor, J. E. (2006). Determinants of migration, destination, and sector choice: Disentangling individual, household, and community effects. In Ozden, C. & Schiff, M. (Eds), International migration, remittances, and the brain drain. Washington: World Bank & Palgrave Macmillan.
Papapanagos, H. & Sanfey, P. (2001). Intention to emigrate in transition countries: The case of Albania. Journal of Population Economics, 14(3): 491-504.
Sun, M. & Fan, C. C. (2011). China’s permanent and temporary migrants: Differentials and changes, 1990-2000. The Professional Geographer, 63(1): 92-112.
Van Dalen, H. P., Groenewold, G. & Schoorl, J. J. (2005). Out of Africa: What drives the pressure to emigrate? Journal of Population Economics, 18(4): 741-778.
Van Dalen, H. P. & Henkens, K. (2007). Longing for the good life: Understanding emigration from a high-income country. Population and Development Review, 33(1): 37-65.
Zhao, Y. (1999). Labor migration and earnings differences: The case of rural China. Economic Development and Cultural Change, 47(4): 767-782.
- AUTHORS PROFILE
- Dr. Jan-Jan Soon is currently Senior Lecturer at Universiti Utara Malaysia. Her expertise areas include migration economics, labour economics, and applied microeconometrics..